Matrix Data Analysis Diagram
Purpose
The purpose of matrix data analysis diagram is to present numerical data about two sets of factors in a matrix form and analyze it to get numerical output. The factors most often are products and product characteristics. The purpose then is to analyze the data on several characteristics for a number of products and use the information to arrive at optimum values for the characteristics for a new product or to decide the strong points of a product and use the information for designing a strategy for the promotion of the product.
Procedure
The procedure for creating a matrix data analysis diagram consists of the following steps:
- Decide the two factors whose relations are to be analyzed.
- Check the number of individual items in the two factors.
- Prepare a matrix to accommodate all the items of the two factors.
- Enter numerical data in the matrix.
- Give the diagram a suitable title.
Applications
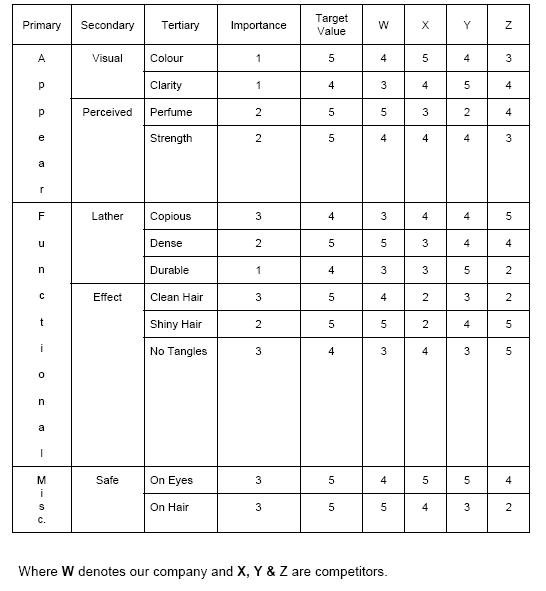
The most common application of matrix data analysis diagram is to decide the desired product characteristics of a new product based on the analysis of product characteristics of similar products in the market and the intended positioning of the new product. For instance the characteristics of cosmetic product for growing children would have characteristics between those of a baby cosmetic and an adult cosmetic. By collecting data on the product characteristics of related products and placing them in a matrix data analysis diagram, one can decide the desired characteristics of the proposed product depending on target group of customers for the new product.
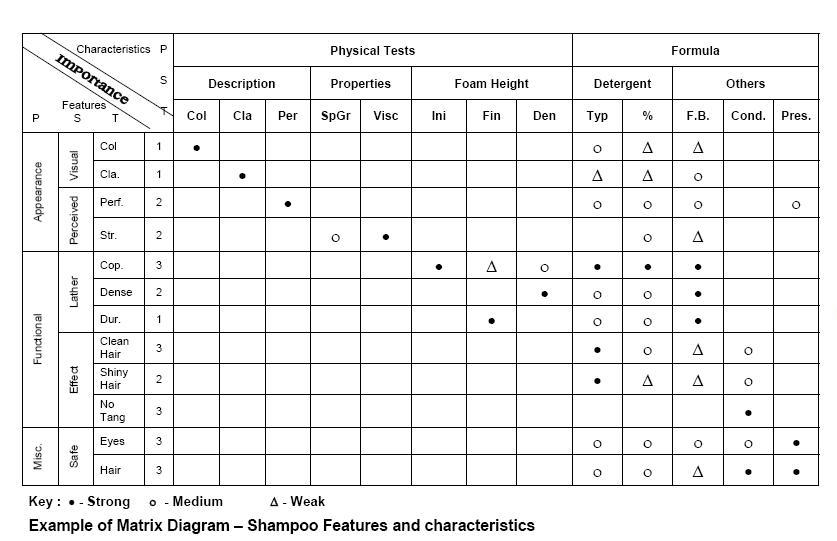
Example of a Matrix Data Analysis Diagram
Analysis of the data can also be used to identify the strongest characteristics of an existing product to decide its promotional inputs. The tool can also be used to study the causes of customer complaints. It can also be used to determine process parameters to achieve desired product characteristics. The tool can be very useful in compiling data obtained on the analysis of competitive products with a view to develop a product better than the competition or to devise a marketing strategy for the product based on its strengths.