1.1. PERT-Programme Evaluation Review Technique-is a powerful Dynamic Management aid for cost reduction. Whenever the execution or completion of projects is delayed, the benefits expected from these projects are postponed. In other words, the anticipated return on investment in these projects will not be realized. Secondly, the cost of these projects which are not completed in the scheduled time are found to be several times more, on completion, than the original estimated costs. A way must, therefore, be found whereby the time taken to complete these projects could be reduced or compressed, and the costs are also controlled.
1.2. If the time required to complete a programme could be reduced, it will be relatively easy to control the costs of the programme. The techniques available to achieve the twin objects of schedule and cost control are PERT, CPM, and LOB. These are essentially planning and control techniques
1.3. Basically, there is not much of a difference between Critical Path Method and PERT, except for the fact that these two have been independently developed within a time interval of one year. The development of network is common to both these techniques. The differences between these two methods are:
1.4. The line of Balance Technique has been developed during World War II. PERT and LOB have certain similarities, but the framework of application is different. There are no predictive features in LOB; in other words, there are no projections concerning potential trouble spots in the future. Owing to this drawback, viz., lack of flexibility and predictive features, Line of Balance has not been used in non- repetitive programmes. Let us now consider the technique of PERT, in explicit relationship with costs, in greater detail.
1.5. PERT consists in obtaining or finding out the critical path in a given flow of work, so that, with the help of this knowledge, optimum use of resources can be achieved by such allocation and reallocation as would give rise to improved results and efficiency.
1.6. For the diagrammatic representation of flow 'of work and its analysis, this technique uses arrow diagrams. The arrow diagram method of work planning and. analysis is flexible in that it permits adjustments, later, without difficulty,. in the presentation of work plans.
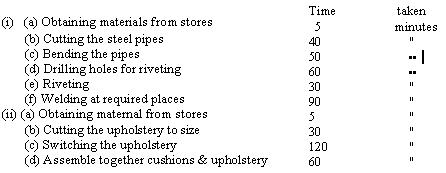
1.7. Let us take a very simple example to illustrate this method, using the arrow diagram, and explain the terms involved in it. Let the proposition be manufacture of motor bus seats. The operations involved are, say-
1.7.1. Assemble both (i) & (ii) to form a complete seat. The arrow diagram for the above is shown below:
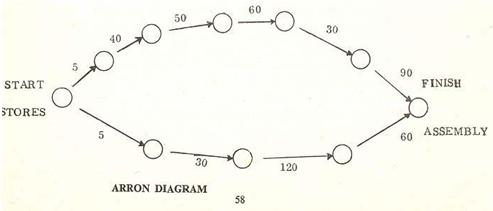
1.7.2. In the diagram the circ1e denotes an event, and the arrow an activity. The activity times are placed the corresponding arrows. The length the arrow has no. relation to the time taken by the activity. In any given piece of work there is a 'Start' and a 'Finish' paint indicating the commencement and completion of work respectively.
1.7.3. Activities (i) and (ii) start at the same time, with materials being drawn far bath from the stares, and are carried an separately. The total time taken by (i) above is obtained by adding up all the contained activity times, and for (ii) also. the total time is similarly obtained. The critical path is the flow line of, work which takes the longest time. In our example, (i) takes longer time, and so. it is the critical path. The difference in the total time taken by (i) and (ii) is called the 'float' time. The event to Which this float time is related is called the slack event.
1.7.4. The times taken by each activity are determined from past experience or by means of technical studies. For the sake of simplicity the times indicated in the given illustration are taken hypothetically, though they may not bear true relationship to reality.
1.7.5. The total time taken for work flow in (i) above is 275 minutes, and for that in (ii), is 215 minutes. The time taken by the flow line of work in (i) is 60 minutes more than that in (ii), and therefore (i) is the critical path.
1.7.6. When work is tarted simultaneously both on (i) and (ii), it can be seen that a minimum of 275 minutes must elapse for the whole work to be ready at 'finish' for final assembly. But if we consider the time taken by (ii) alone to reach the finishing stage, it is 215 minutes only, i.e., less by 60 minutes than that taken by (i). Thus, activity (i) controls the total time required for making the final seat, and that is why it is called critical.
1.7.7. Now the attempt in all this is to use the float time in (ii) by transfer of resources from (ii) to. (i) so as to reduce the overall total time required for reaching the 'finish'. By transfer of resources, it is meant, that some labium hours or machine hours, etc., manifesting in (ii) as 'float' time, be advantageously utilised for speeding up work in (i). But the basic proviso here is that these resources are interchangeable or adaptable to Slight variations in the nature of work. This does not seem to. be really possible in the illustration given here, but it explains the method of using the float time.
1.7.8. The above objective requires a careful consideration of:
1.8. The example given above is very simple, involving few activities. :Rut it is quite usual to face, in actual practice, planning problems involving a very large number of activities. In the latter case computers may have to be used for determining the critical path, and for further analysis, to reduce total time of work. This should finally lead to the finding of the best possible methods and ways of doing work from the start to finish.
2.1. There are two types of programmes, which emphasise the application of new management techniques such as PERT:
2.2. PERT acts as Manager's tool for defining and coordination what must be done to accomplish successfully the objectives of a project on time. It can: be applied to any field of endeavor which requires planned, controlled, and integrated work efforts to accomplish established goals and complete a programme on time. PERT is a technique that aids the decision-maker, but does not make decisions for him. It provides statistical information regarding the uncertainties faced in completing the different activities associated with a project. It is a method of focusing managerial attention on latent problems that require decisions and/or solutions. It reveals to the Management the procedures and adjustments required regarding time, resources or performance which may improve the capacity of meeting the target dates.
3.1. There are three major initial planning values derived from PERT. They are the improved planning action, improved orientation of planning to the fundamentals of the business, and an improved basis for evaluating the plan in terms of its ability to meet management objectives.
3.2. Top management is rightly critical of a great deal of planning because of its high theoretical content. PERT provides a practical methodology, and the very elements of project success, time and costs are competently estimated and become part of the plan. If the network is sufficiently detailed, each activity can be represented by a budget number.
3.3. One of the most useful yields of PERT is its progress reporting. PERT lays the basis for anticipating management action against trouble spots likely to appear. As activities are completed, the actual time and costs are substituted for the previous estimates. The system is then processed to determine the effects of these performances on the total project. The progress or lacks of progress of the project can thus be analyzed. PERT thus eliminates 'lag' reporting, and institutes anticipating reporting.
3.4. Thus the quality, timeliness, frequency, relationship, and anticipating characteristics of PERT distinguishes it from other conventional techniques, and helps management in establishing its responsibilities and in achieving its objectives.
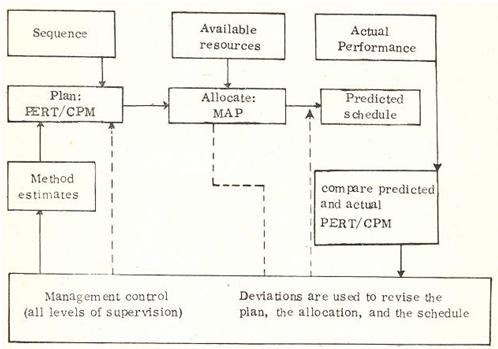
3.5. As the primary purpose of applying PERT to any project is to create a plan and schedule,the steps in planning and scheduling a project are given below:
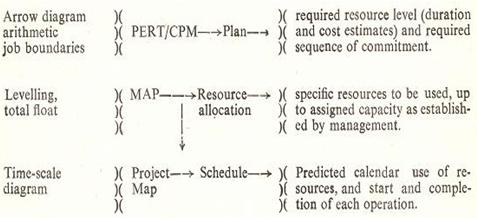
The new concept shown in the figure on page 62 represents the true approach the total approach-to the application of PERT to determine a 'plan' and a 'schedule'.
4.1. PERT, when developed originally in connexion with the Polaris Missile Programme, was only time-oriented. It was during the period 1962-63 that the original time- oriented characteristic of PERT was extended to include manpower and cost elements. Now, we shall consider the most important developments in PERT Management systems, viz., the introduction of costs in an explicit relationship with the network. PERT/Cost cannot be considered independently of time-oriented PERT. In fact, PERT/Cost assumes the development of network before the costing phase can be completed. PERT/Cost to be effective requires those persons who had the experience of developing and implementing PERT/Time (time-oriented PERT). The central idea of PERT Cost is the direct association of programme costs with activities on an established time network. As in PERT/Time we are concerned in the use of PERT/Cost only with one-time-through programmes, such as capital• or construction programmes and Research and Development programmes, and not repetitive manufacturing programmes, where costs are associated with the number of units produced.
The fundamental objectives of PERT/Cost are twofold:
4.1.1. There are also potential areas of cost reduction or increase in efficiency made possible by the application of PERT Management systems. With these objectives, let us now consider the basic methodology of PERT/Cost.
4.2. The association of the cost factor with PERT requires the completion of network unlike in time-oriented PERT. All activities which carry direct cost must be indicated on the network. In order to provide a framework for complete networking, the work or Task Breakdown structure should be developed as the first step in any basic PERT/Cost analysis. The must significant feature of the work breakdown structure is to provide a foam work for identifying all the major tasks of a programme, the emphasis being on the product-oriented structuring of these tasks. The work breakdown structure is, therefore, generally product- oriented, in the sense that it is comparable to what is often known as unit assembly of a drawing breakdown sequence.
4.3 In the case of large programmes, there is widely varying consensus of opinion as to at what particular level the work breakdown structure should be functionally (i.e. organizationally) structured as against a product-oriented one. One of the main objectives of PERT/Cost, and in fact one of its new features, is to establish a time and Cost Correlation of tasks which are product-oriented. From the PERT/Cost, fune tionally oriented budget and cost information can be derived, and it may be pointed that work breakdown structure can be partially structured on a functional basis, where product orientation is not significant, as in the case of programme management. The work breakdown structure, if properly developed, provides the key to an integrated programme management system for performance time and cost factors. If any areas in the initial work breakdown structure have not been fairly developed, provision for contingency End Item Subdivisions must be made.
4.4. It is desirable to develop the work breakdown structure through a number of levels, before reflecting the End Item Level, against which meaningful PERT networks can be developed. After carrying out a thorough analysis of PERT network covering all the End Item Subdivisions, the next step is to establish cost work packages, which are associated with the networks.
4.5. A cost-work package is established by aggregating a group of activities within the network. In establishing the cost-work packages, it should be ensured that all activities in the network under an End Item Subdivision fall within a work package, and that all work packages must be capable of summarization to an End Item Subdivision. There are two criteria in setting up the work packages:
4.5.1. However, in fixing the monetary limit of work packages, the following factors are taken into account:
4.6. It is necessary to establish the starting and terminating events for each work package, in order to derive the benefit of correlating the time and cost performance. This requires that work packages should be built around continuous paths, Another problem is whether work package is functional or represents another level of task breakdown involving various organization elements and/or resource skills. All these limitations and factors have to be considered in setting up work packages, involving judgment and depth of knowledge on the content of network. It is also desirable to indicate a single individual or party as having unit responsibility, for anyone work package.
5.1 Work Package Cost estimating data are then developed showing man hour requirements by resource skills converted into money value together with material requirements- and other resources needed, expressed in monetary terms, for input into the PERT/Cost system. Time data are, of course, based on scheduled elapsed times for network activities It is necessary to make estimates on a periodic basis to develop cost data to complete each work package that has been commenced., The time schedule of each activity in a work package is examined, and all the schedule slippages are analyzed to determine the need for revising the original time and cost estimates. Schedule slippages, however, call for revised estimates, and a reallocation of resources.
5.2 The updating of cost estimates is facilitated by setting up specific review dates. Estimates can be easily prepared and revised by assigning responsibility to individuals in the programme performance. The cost and resources updating worksheet can be used as a detailed record of current costs and resource estimates an1i as a guide for the preparation of the latest revised estimates.
5.3 With the help of the data processing equipment, a number of output reports are prepared analyzing the problems and identifying the areas or sources of those problems. These reports, therefore, lead naturally to executive decision and early action. The following are the main reports:
6.1. One of the more commonly known modifications of PERT/Cost technique is the 'time-cost optimization or augmentation' technique originally developed in connexion with the Critical Path Method. Under this metalloid, there will be two sets of time, and cost data, viz., normal and crash. In the 'normal' estimate, the stress is on cost with time being associated with minimum cost. The 'crash’ estimate, on the other hand, involves the absolute minimum time required for the programme, and the cost necessary to achieve that time.
6.2 Compression of time involves cost; in other words, time can be bought only with money and resources. It is, therefore, necessary to estimate the cost to expedite the programme. From a graphical representation of time and cost, it is possible to show the cost to expedite.
6.3. An analysis of the cost to expedite each activity in the critical path provides way to crash or compress an activity by which minimum increase in cost per unit of time saved is obtained. A new schedule with a higher cost level will then emerge.
6.4. When activities along the critical path are expedited, the direct cost is likely to increase, whereas the indirect cost or overhead cost is likely to reduce with reduction in project time. It is, therefore, necessary to have the following cost data for expediting:
6.5. While expediting the activities along the critical path, the activities which cost less should be expedited first in order to keep the overall expediting cost to a minimum
6.6. Keeping these broad principles in mind, the steps required for expediting are given below:
(*These are direct costs which increase with expediting).
6.7. Expediting of activities on critical path (s) will give a set of value of total elapsed time of a project under step (viii), and corresponding total expediting (direct) costs under step (ix.) This data can be tabulated as follows:
Project elapsed Direct cost Indirect cost Total cost
6.8 The direct, indirect and total costs can now be plotted against the time-scale known as the least cost curve:
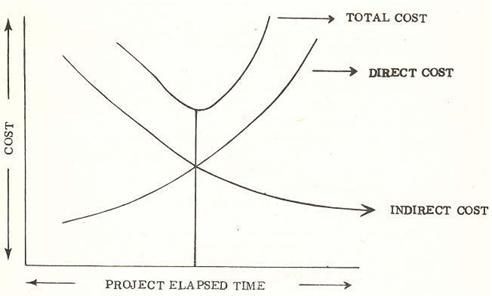
The point X, on the horizontal time-scale, is the optimum project elapsed time, leading to minimum project cost.
6.9. Sometimes penalty cost is also taken into account in addition to the direct and indirect costs. This cost may represent loss in production resulting, from the shut- down time of the plant or in the value of a product not marketed at the earliest possible time relative to competing products.
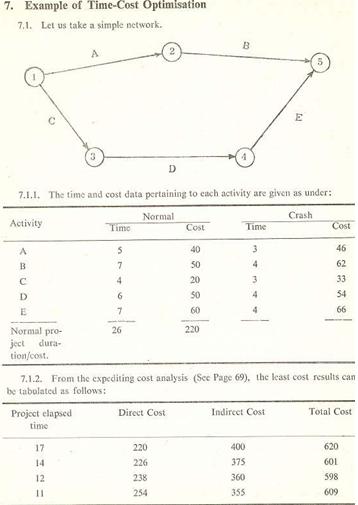
7.1.3. Thus the project duration of 12 units of time wili yield the minimum project cost.
7.1.4. The optimum project duration can also be read from the least cost curve, as discussed earlier.
8.1. To sum up, PERT/Cost information aids management in identifying trouble spots and problem areas sufficiently in advance, so that the management can make timely decision and take such corrective action as diversion of resources to critical areas to ensure accomplishment of programme to schedule, and to prevent costs from over-running. The timely summarizing of PERT/Cost information and its presentation in a decision-making form enables the evaluation of programme status by the Management without reviewing the entire mass of information. The integrated nature of the PERT/Cost reporting system can provide any additional information needed by management for a more detailed analysis when it is confronted with specific Problems. Managements of industrial enterprises thus stand to gain by the application of PERT in the planning, execution, and control of their programmes. In fact, the scope of PERT and its application have increased enormously during the last two years, as to cover such fields as Systems Engineering, Configuration Management, and Profit Control.
8.2. A few of the successful applications of PERT resulting in Cost Reduction may be cited here: