In the process of energy management, at some stage, investment would be required for reducing the energy consumption of a process or utility. Investment would be required for modifications/retrofitting and for incorporating new technology. It would be prudent to adopt a systematic approach for merit rating of the different investment options vis-à-vis the anticipated savings. It is essential to identify the benefits of the proposed measure with reference to not only energy savings but also other associated benefits such as increased productivity, improved product quality etc.
The cost involved in the proposed measure should be captured in totality viz.
Based on the above, the investment analysis can be carried out by the techniques explained in the later section of the chapter.
To persuade your organization to commit itself to a program of investment in energy efficiency, you need to demonstrate:
The need for investments in energy conservation can arise under following circumstances
Any investment has to be seen as an addition and not as a substitute for having effective management practices for controlling energy consumption throughout your organization.
Spending money on technical improvements for energy management cannot compensate for inadequate attention to gaining control over energy consumption. Therefore, before you make any investments, it is important to ensure that
When listing investment opportunities, the following criteria need to be considered:
One of the most difficult problems which many energy managers face is justifying why their organization should invest money in increasing its energy efficiency, especially when there are other, seemingly more important priorities for the use of its capital.
Energy manager has to identify how cost savings arising from energy management could be redeployed within his organization to the maximum effect. To do this, he has to work out how benefits of increased energy efficiency can be best sold to top management as,
In most respects, investment in energy efficiency is no different from any other area of financial management. So when your organization first decides to invest in increasing its energy efficiency it should apply exactly the same criteria to reducing its energy consumption as it applies to all its other investments. It should not require a faster or slower rate of return on investment in energy efficiency than it demands elsewhere. The basic criteria for financial investment appraisal include:
Initially, when you can identify no or low cost investment opportunities, this principle should not be difficult to maintain. However, if your organization decides to fund a rolling program of such investments, then over time it will become increasingly difficult for you to identify opportunities, which conform to the principle. Before you’ll reach this position, you need to renegotiate the basis on which investment decisions are made.
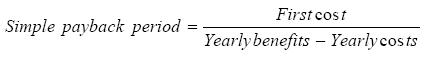
It may require particular thoroughness to ensure that all the costs and benefits arising are taken into account. As an approximate appraisal, simple payback (the total cost of the measure divided by the annual savings arising from it expressed as years required for the original investment to be returned) is a useful tool.
As the process becomes more sophisticated, financial criteria such as Discounted Cash Flow, Internal Rate of Return and Net Present Value may be used. If you do not possess sufficient financial expertise to calculate these yourself, you will need to ensure that you have access, either within your own staff or elsewhere within the organization, to people who can employ them on your behalf.
There are two quite separate grounds for arguing that, at least towards the later part of your energy management program, your organization could begin to apply a slower rate of return to its investments in energy efficiency than it applies elsewhere.
The benefits arising from some energy saving measures may continue long after their payback periods. Such measure does not need to be written off using fast discounting rates but can be regarded as adding to the long term value of the assets. For this reason, short term payback can be an inadequate yardstick for assessing longer term benefits. To assess the real gains from investing in saving energy, you should use investment appraisal techniques, which accurately reflect the longevity of the returns on particular types of technical measures.
It is essential to keep a careful watch on your organization’s maintenance policy and practices in order to protect any investment already made in reducing your organization’s energy consumption. There is a clear dependence relationship between energy efficiency and maintenance. This operates at two levels:
In this chapter, investment analysis tools relevant to energy management projects will be discussed.
Simple Payback Period (SPP) represents, as a first approximation; the time (number of years) required to recover the initial investment (First Cost), considering only the Net Annual Saving:
The simple payback period is usually calculated as follows:
Advantages
A widely used investment criterion, the payback period seems to offer the following advantages:
Limitations
To illustrate, consider the cash flows of two projects, A and B:
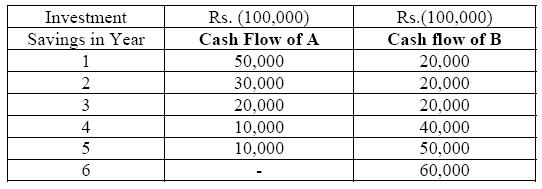
The payback criterion prefers A, which has a payback period of 3 years, in comparison to B, which has a payback period of 4 years, even though B has very substantial cash inflows in years 5 and 6.
It is a measure of a project’s capital recovery, not profitability.
Despite its limitations, the simple payback period has advantages in that it may be useful for evaluating an investment.
A project usually entails an investment for the initial cost of installation, called the capital cost, and a series of annual costs and/or cost savings (i.e. operating, energy, maintenance, etc.) throughout the life of the project. To assess project feasibility, all these present and future cash flows must be equated to a common basis. The problem with equating cash flows which occur at different times is that the value of money changes with time. The method by which these various cash flows are related is calleddiscounting, or thepresent value concept.
For example, if money can be deposited in the bank at 10% interest, then a Rs.100 deposit will be worth Rs.110 in one year's time. Thus the Rs.110 in one year is a future value equivalent to the Rs.100 present value.
In the same manner, Rs.100 received one year from now is only worth Rs.90.91 in today's money (i.e. Rs.90.91 plus 10% interest equals Rs.100). Thus Rs.90.91 represents the present value of Rs.100 cash flow occurring one year in the future. If the interest rate were something different than 10%, then the equivalent present value would also change. The relationship between present and future value is determined as follows:
Future Value (FV) = NPV (1 + i)n or NPV = FV / (1+i)n
Where ,
FV = Future value of the cash flow
NPV= Net Present Value of the cash flow
i = Interest or discount rate
n = Number of years in the future
ROI expresses the "annual return" from the project as a percentage of capital cost. The annual return takes into account the cash flows over the project life and the discount rate by converting the total present value of ongoing cash flows to an equivalent annual amount over the life of the project, which can then be compared to the capital cost. ROI does not require similar project life or capital cost for comparison.
This is a broad indicator of the annual return expected from initial capital investment, expressed as a percentage:
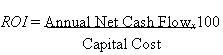
ROI must always be higher than cost of money (interest rate); the greater the return on investment better is the investment.
Limitations
The net present value (NPV) of a project is equal to the sum of the present values of all the cash flows associated with it. Symbolically,
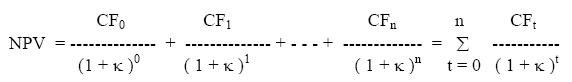
Where ,
NPV = Net Present Value
CFt = Cash flow occurring at the end of year ‘t’ (t=0,1,….n)
n = life of the project
κ = Discount rate
The discount rate (κ) employed for evaluating the present value of the expected future cash flows should reflect the risk of the project.
Advantages
The net present value criterion has considerable merits.
This method calculates the rate of return that the investment is expected to yield. The internal rate of return (IRR) method expresses each investment alternative in terms of a rate of return (a compound interest rate). The expected rate of return is the interest rate for which total discounted benefits become just equal to total discounted costs (i.e net present benefits or net annual benefits are equal to zero, or for which the benefit / cost ratio equals one). The criterion for selection among alternatives is to choose the investment with the highest rate of return.
The rate of return is usually calculated by a process of trial and error, whereby the net cash flow is computed for various discount rates until its value is reduced to zero.
The internal rate of return (IRR) of a project is the discount rate, which makes its net present value (NPV) equal to zero. It is the discount rate in the equation:
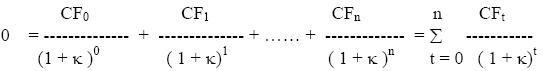
where,
CFt = cash flow at the end of year “t”
κ = discount rate
n = life of the project.
CFt value will be negative if it is expenditure and positive if it is savings. (7.1) In the net present value calculation we assume that the discount rate (cost of capital) is known and determine the net present value of the project. In the internal rate of return calculation, we set the net present value equal to zero and determine the discount rate (internal rate of return), which satisfies this condition.
Advantages
A popular discounted cash flow method, the internal rate of return criterion has several advantages:
Limitations
Generally there are two kinds of cash flow; the initial investment as one or more installments, and the savings arising from the investment. This over simplifies the reality of energy management investment.
There are usually other cash flows related to a project. These include the following:
Factors that need to be considered in calculating annual cash flows are:-
Many of the cash flows in the project are based on assumptions that have an element of uncertainty. The present day cash flows, such as capital cost, energy cost savings, maintenance costs, etc can usually be estimated fairly accurately. Even though these costs can be predicted with some certainty, it should always be remembered that they are only estimates. Cash flows in future years normally contain inflation components which are often "guess-timates" at best. The project life itself is an estimate that can vary significantly.
Sensitivity analysis is an assessment of risk. Because of the uncertainty in assigning values to the analysis, it is recommended that a sensitivity analysis be carried out - particularly on projects where the feasibility is marginal. How sensitive is the project's feasibility to changes in the input parameters? What if one or more of the factors in the analysis is not as favourable as predicted? How much would it have to vary before the project becomes unviable? What is the probability of this happening?
Suppose, for example, that a feasible project is based on an energy cost saving that escalates at 10% per year, but a sensitivity analysis shows the break-even is at 9% (i.e. the project becomes unviable if the inflation of energy cost falls below 9%). There is a high degree of risk associated with this project - much greater than if the break-even value was at 2%.
Many of the computer spreadsheet programs have built-in "what if" functions that make sensitivity analysis easy. If carried out manually, the sensitivity analysis can become laborious - reworking the analysis many times with various changes in the parameters.
Sensitivity analysis is undertaken to identify those parameters that are both uncertain and for which the project decision, taken through the NPV or IRR, is sensitive. Switching values showing the change in a variable required for the project decision to change from acceptance to rejection are presented for key variables and can be compared with post evaluation results for similar projects. For large projects and those close to the cut-off rate, a quantitative risk analysis incorporating different ranges for key variables and the likelihood of their occurring simultaneously is recommended. Sensitivity and risk analysis should lead to improved project design, with actions mitigating against major sources of uncertainty being outlined
The various micro and macro factors that are considered for the sensitivity analysis are listed below.
Macro economic variables are the variable that affects the operation of the industry of which the firm operates. They cannot be changed by the firm’s management.
Macro economic variables, which affect projects, include among others:
The sensitivity analysis will bring changes in various items in the analysis of financial statements or the projects, which in turn might lead to different conclusions regarding the implementation of projects
There are various options for financing in-house energy management
One way to make energy management self-financing is to split savings to provide identifiable returns to each interested party. This has the following benefits:
After implementation of energy savings, your organization ought to be able to make considerable savings at little cost (except for the funding needed for energy management staff). The important question is what should happen to these savings?
If part of these easily achieved savings is not returned to your budget as energy manager, then your access to self-generated investments funds to support future activities will be lost. And later in the program, it is likely to be much harder for you to make savings.
However, if, an energy manager, has access to a proportion of the revenue savings arising from staff’s activities, then these can be reinvested in:
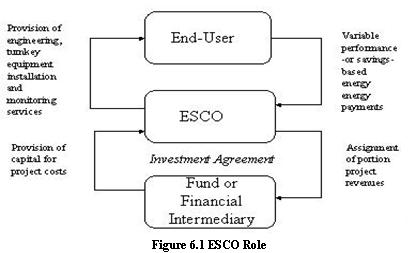
If the project is to be financed externally, one of the attractive options for many organizations is the use of energy performance contracts delivered by energy service companies, or ESCOs.
ESCOs are usually companies that provide a complete energy project service, from assessment to design to construction or installation, along with engineering and project management services, and financing. In one way or another, the contract involves the capitalization of all of the services and goods purchased, and repayment out of the energy savings that result from the project.
In performance contracting, an end-user (such as an industry, institution, or utility), seeking to improve its energy efficiency, contracts with ESCO for energy efficiency services and financing.
In some contracts, the ESCOs provide a guarantee for the savings that will be realized, and absorbs the cost if real savings fall short of this level. Typically, there will be a risk management cost involved in the contract in these situations. Insurance is sometimes attached, at a cost, to protect the ESCO in the event of a savings shortfall.
Energyefficiencyprojectsgenerate incremental cost savings as opposed to incremental revenues from the sale of outputs. The energy cost savings can be turned into incremental cash flows to the lender or ESCO based on the commitment of the energy user (and in some cases, a utility) to pay for the savings.
Performance contracting represents one of the ways to address several of the most frequently mentioned barriers to investment. Performance contracting through an ESCO transfers the technology and management risks away from the end-user to the ESCO.
For energy users reluctant to invest in energy efficiency, a performance contract can be a powerful incentive to implement a project. Performance contracting also minimizes or eliminates the up-front cash outlay required by the end-user. Payments are made over time as the energy savings are realized.